
HEAD-TO HEAD COMPARISON
Here’s a head-to-head comparison of the current real estate market conditions for Q1-2024 between Westchester County, NY, and Fairfield County, CT.
Fairfield:
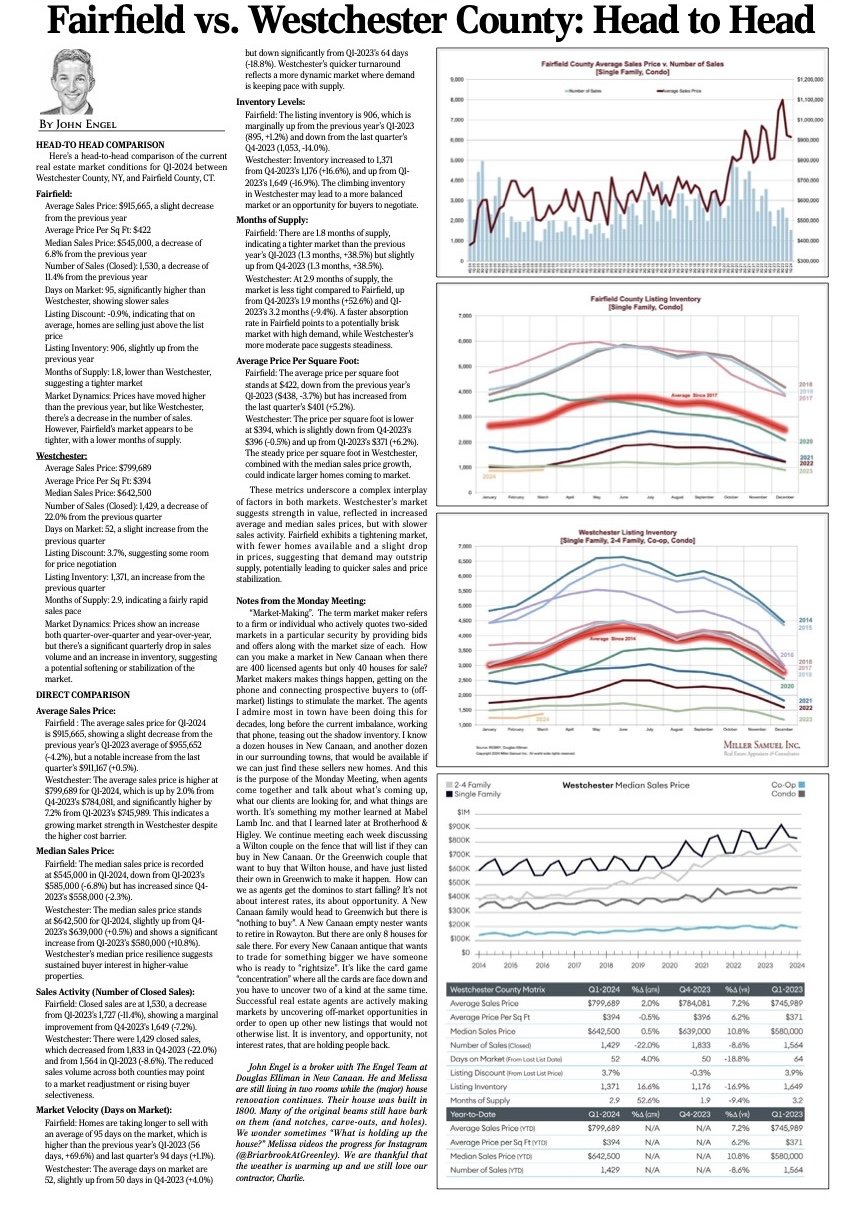
Average Sales Price: $915,665, a slight decrease from the previous year
Average Price Per Sq Ft: $422
Median Sales Price: $545,000, a decrease of 6.8% from the previous year
Number of Sales (Closed): 1,530, a decrease of 11.4% from the previous year
Days on Market: 95, significantly higher than Westchester, showing slower sales
Listing Discount: -0.9%, indicating that on average, homes are selling just above the list price
Listing Inventory: 906, slightly up from the previous year
Months of Supply: 1.8, lower than Westchester, suggesting a tighter market
Market Dynamics: Prices have moved higher than the previous year, but like Westchester, there’s a decrease in the number of sales. However, Fairfield’s market appears to be tighter, with a lower months of supply.
Westchester:
Average Sales Price: $799,689
Average Price Per Sq Ft: $394
Median Sales Price: $642,500
Number of Sales (Closed): 1,429, a decrease of 22.0% from the previous quarter
Days on Market: 52, a slight increase from the previous quarter
Listing Discount: 3.7%, suggesting some room for price negotiation
Listing Inventory: 1,371, an increase from the previous quarter
Months of Supply: 2.9, indicating a fairly rapid sales pace
Market Dynamics: Prices show an increase both quarter-over-quarter and year-over-year, but there’s a significant quarterly drop in sales volume and an increase in inventory, suggesting a potential softening or stabilization of the market.
DIRECT COMPARISON
Average Sales Price:
Fairfield : The average sales price for Q1-2024
is $915,665, showing a slight decrease from the previous year’s Q1-2023 average of $955,652 (-4.2%), but a notable increase from the last quarter’s $911,167 (+0.5%).
Westchester: The average sales price is higher at $799,689 for Q1-2024, which is up by 2.0% from Q4-2023’s $784,081, and significantly higher by 7.2% from Q1-2023’s $745,989. This indicates a growing market strength in Westchester despite the higher cost barrier.
Median Sales Price:
Fairfield: The median sales price is recorded at $545,000 in Q1-2024, down from Q1-2023’s $585,000 (-6.8%) but has increased since Q4- 2023’s $558,000 (-2.3%).
Westchester: The median sales price stands
at $642,500 for Q1-2024, slightly up from Q4- 2023’s $639,000 (+0.5%) and shows a significant increase from Q1-2023’s $580,000 (+10.8%). Westchester’s median price resilience suggests sustained buyer interest in higher-value properties.
Sales Activity (Number of Closed Sales):
Fairfield: Closed sales are at 1,530, a decrease from Q1-2023’s 1,727 (-11.4%), showing a marginal improvement from Q4-2023’s 1,649 (-7.2%). Westchester: There were 1,429 closed sales, which decreased from 1,833 in Q4-2023 (-22.0%) and from 1,564 in Q1-2023 (-8.6%). The reduced sales volume across both counties may point
to a market readjustment or rising buyer selectiveness.
Market Velocity (Days on Market):
Fairfield: Homes are taking longer to sell with an average of 95 days on the market, which is higher than the previous year’s Q1-2023 (56 days, +69.6%) and last quarter’s 94 days (+1.1%). Westchester: The average days on market are 52, slightly up from 50 days in Q4-2023 (+4.0%) but down significantly from Q1-2023’s 64 days (-18.8%). Westchester’s quicker turnaround reflects a more dynamic market where demand is keeping pace with supply.
Inventory Levels:
Fairfield: The listing inventory is 906, which is marginally up from the previous year’s Q1-2023 (895, +1.2%) and down from the last quarter’s Q4-2023 (1,053, -14.0%).
Westchester: Inventory increased to 1,371
from Q4-2023’s 1,176 (+16.6%), and up from Q1- 2023’s 1,649 (-16.9%). The climbing inventory
in Westchester may lead to a more balanced market or an opportunity for buyers to negotiate.
Months of Supply:
Fairfield: There are 1.8 months of supply, indicating a tighter market than the previous year’s Q1-2023 (1.3 months, +38.5%) but slightly up from Q4-2023 (1.3 months, +38.5%). Westchester: At 2.9 months of supply, the market is less tight compared to Fairfield, up from Q4-2023’s 1.9 months (+52.6%) and Q1- 2023’s 3.2 months (-9.4%). A faster absorption rate in Fairfield points to a potentially brisk market with high demand, while Westchester’s more moderate pace suggests steadiness.
Average Price Per Square Foot:
Fairfield: The average price per square foot stands at $422, down from the previous year’s Q1-2023 ($438, -3.7%) but has increased from the last quarter’s $401 (+5.2%).
Westchester: The price per square foot is lower at $394, which is slightly down from Q4-2023’s $396 (-0.5%) and up from Q1-2023’s $371 (+6.2%). The steady price per square foot in Westchester, combined with the median sales price growth, could indicate larger homes coming to market.
These metrics underscore a complex interplay of factors in both markets. Westchester’s market suggests strength in value, reflected in increased average and median sales prices, but with slower sales activity. Fairfield exhibits a tightening market, with fewer homes available and a slight drop in prices, suggesting that demand may outstrip supply, potentially leading to quicker sales and price stabilization.
Notes from the Monday Meeting:
“Market-Making”. The term market maker refers to a firm or individual who actively quotes two-sided markets in a particular security by providing bids and offers along with the market size of each. How can you make a market in New Canaan when there are 400 licensed agents but only 40 houses for sale? Market makers makes things happen, getting on the phone and connecting prospective buyers to (off- market) listings to stimulate the market. The agents I admire most in town have been doing this for decades, long before the current imbalance, working that phone, teasing out the shadow inventory. I know a dozen houses in New Canaan, and another dozen in our surrounding towns, that would be available if we can just find these sellers new homes. And this is the purpose of the Monday Meeting, when agents come together and talk about what’s coming up, what our clients are looking for, and what things are worth. It’s something my mother learned at Mabel Lamb Inc. and that I learned later at Brotherhood & Higley. We continue meeting each week discussing a Wilton couple on the fence that will list if they can buy in New Canaan. Or the Greenwich couple that want to buy that Wilton house, and have just listed their own in Greenwich to make it happen. How can we as agents get the dominos to start falling? It’s not about interest rates, its about opportunity. A New Canaan family would head to Greenwich but there is “nothing to buy”. A New Canaan empty nester wants to retire in Rowayton. But there are only 8 houses for sale there. For every New Canaan antique that wants to trade for something bigger we have someone who is ready to “rightsize”. It’s like the card game “concentration” where all the cards are face down and you have to uncover two of a kind at the same time. Successful real estate agents are actively making markets by uncovering off-market opportunities in order to open up other new listings that would not otherwise list. It is inventory, and opportunity, not interest rates, that are holding people back.
John Engel is a broker with The Engel Team at Douglas Elliman in New Canaan. He and Melissa are still living in two rooms while the (major) house renovation continues. Their house was built in 1800. Many of the original beams still have bark on them (and notches, carve-outs, and holes). We wonder sometimes “What is holding up the house?” Melissa videos the progress for Instagram (@BriarbrookAtGreenley). We are thankful that the weather is warming up and we still love our contractor, Charlie.
Check out John Engel’s Podcast, Boroughs & Burbs, the National Real Estate Conversation here.
Read this article on the New Canaan Sentinel website here.