
Navigating the Connecticut Real Estate Landscape: A Comprehensive Outlook

As we reflect on the past year, the real estate market has been nothing short of dynamic and transformative. As we stand on the cusp of a new era, many are eager to discern the trajectory of Connecticut’s real estate landscape, particularly in Fairfield County and New Canaan. In this comprehensive blog post, we delve […]
Interactive Map of the 2023 New Canaan Revaluation
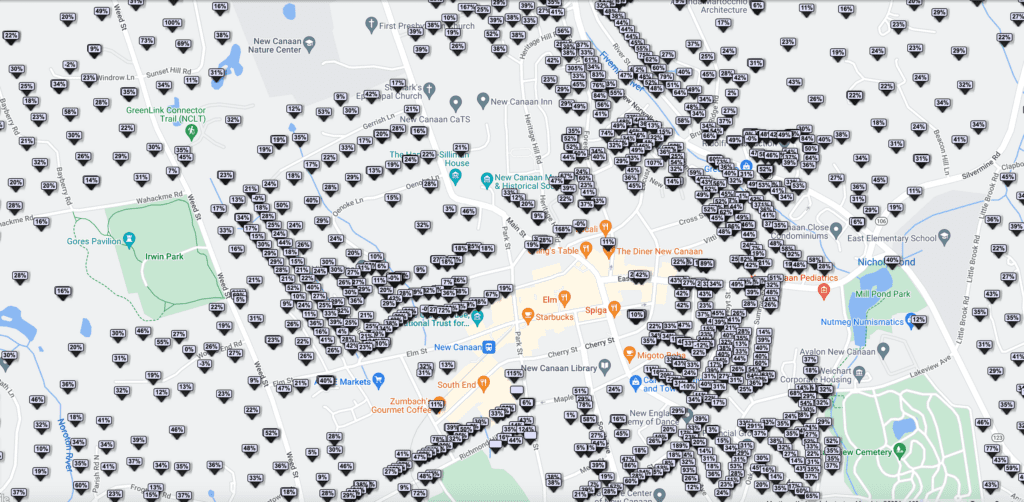
the New Canaan revaluation, 2023, showing the differences from the prior valuation
Week 17: Zoning Zoning Zoning. John Engel’s Real Estate Column for the New Canaan Sentinel
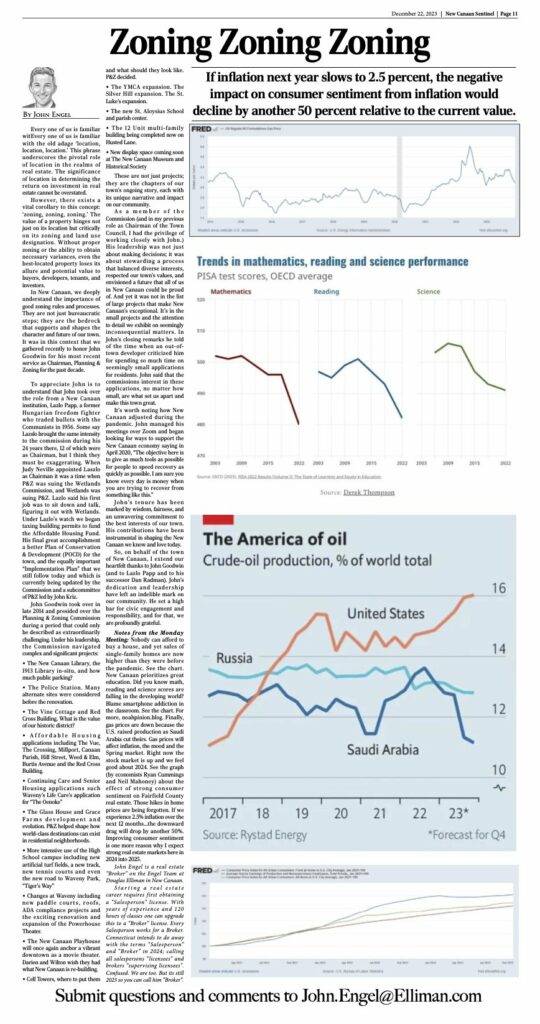
If inflation next year slows to 2.5 percent, the negative impact on consumer sentiment from inflation would decline by another 50 percent relative to the current value.
Week 16: Signs of a Coming Recession? John Engel’s Real Estate Column for the New Canaan Sentinel
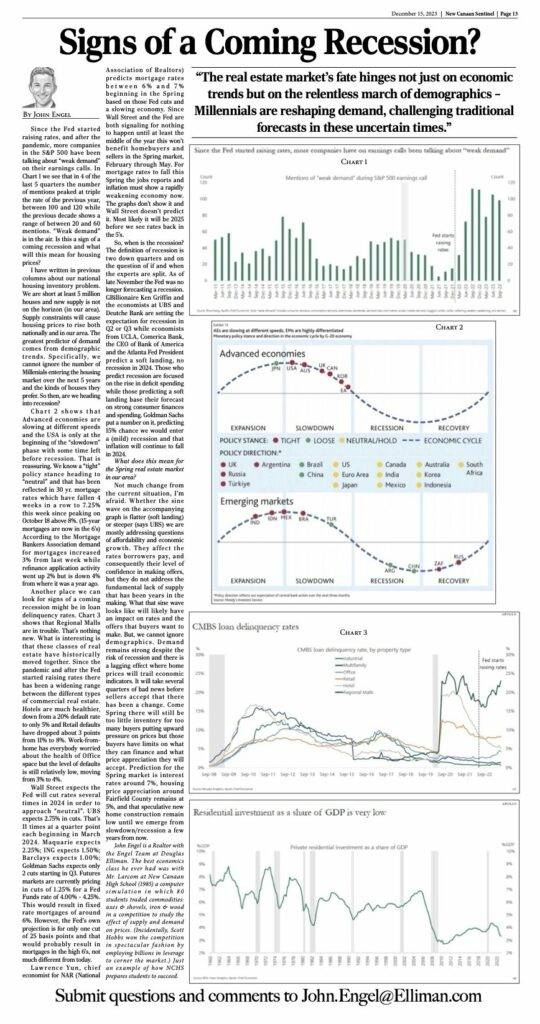
“The real estate market’s fate hinges not just on economic trends but on the relentless march of demographics – Millennials are reshaping demand, challenging traditional forecasts in these uncertain times.”
Week 15: November Market Report. John Engel’s Real Estate Column for the New Canaan Sentinel
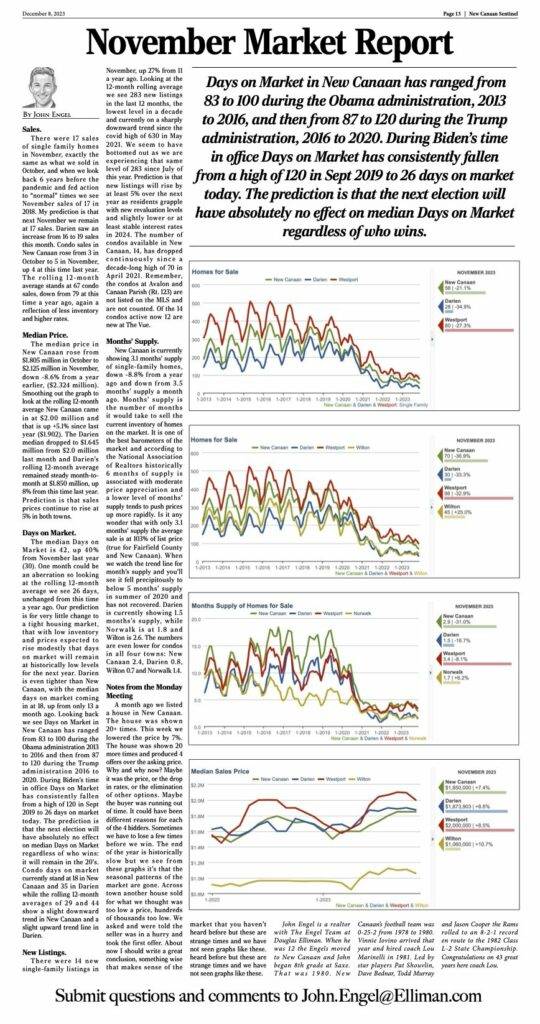
Days on Market in New Canaan has ranged from 83 to 100 during the Obama administration, 2013 to 2016, and then from 87 to 120 during the Trump administration, 2016 to 2020. During Biden’s time in office Days on Market has consistently fallen from a high of 120 in Sept 2019 to 26 days on market today. The prediction is that the next election will have absolutely no effect on median Days on Market regardless of who wins.
Week 14: Why Do Showing Agents Matter? John Engel’s Real Estate Column for the New Canaan Sentinel
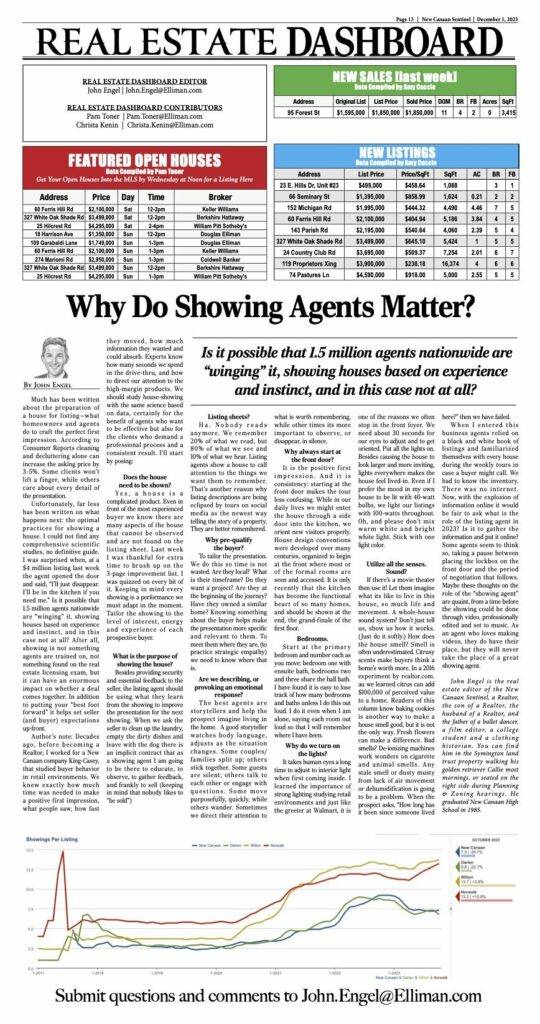
Is it possible that 1.5 million agents nationwide are “winging” it, showing houses based on experience and instinct, and in this case not at all?
Week 13: $3 Million. John Engel’s Real Estate Column for the New Canaan Sentinel
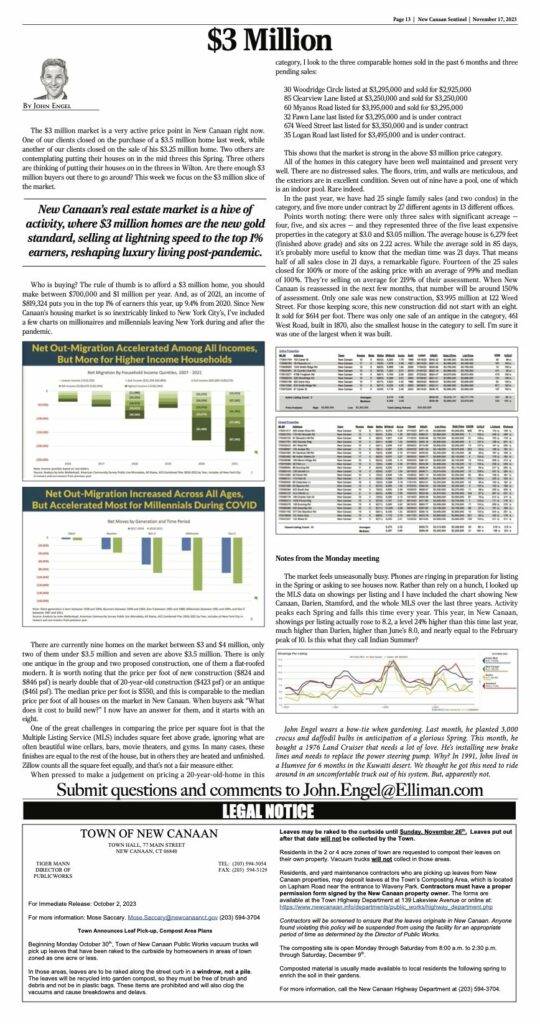
The $3 million market is a very active price point in New Canaan right now One of our clients closed on the purchase of a $3.5 million home last week, while another of our clients closed on the sale of his $3.25 million home. Two others are contemplating putting their houses on in the mid […]
Week 12: Winter is Coming. John Engel’s Real Estate Column for the New Canaan Sentinel
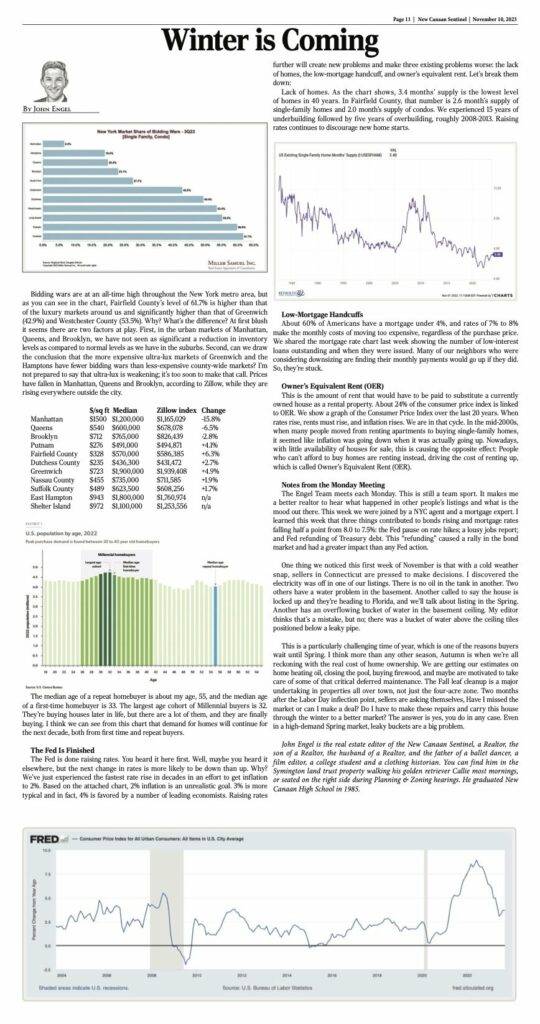
Bidding wars are at an all-time high throughout the New York metro area, but as you can see inthe chart Fairfield County’s level of 61.7% is higher than that of the luxury markets around us and significantly higher than that of Greenwich (42.9%) and Westchester County (53.5%). Why? What’s the difference? At first blush it seems there are two factors at play. First, in the urban markets of Manhattan, Queens and Brooklyn we have not seen as significant a reduction in inventory levels as compared to normal levels as we have in the suburbs. Second, can we draw the conclusion that the more expensive ultra-lux markets of Greenwich and the Hamptons have fewer bidding wars than less-expensive county-wide markets? Prices have fallen in Manhattan,Queens and Brooklyn, according to Zillow, while rising everywhere outside the city.
🏡 Fairfield County: Real Estate Rising? The Engel Team Q3 Market Report

How do we differentiate between moderately strong and strong in the town by town analysis below? Mostly we looked at price appreciation. Those towns which are still seeing price appreciation above 5% annually are characterized as strong. This is a better metric than days on market or percentage of asking price.
DEKF Ski Property Report 2024
With the release of the 2024 Douglas Elliman | Knight Frank Ski Property Report, three Elliman agents—Riley Warwick (RW), Melanie Muss (MM) and Raifie Bass (RB) discussed the state of the ski property market in Aspen, Colorado, with Kate Everett-Allen, Head of Global Residential Research for Knight Frank. Their conversation follows.