
Fairfield County’s most expensive markets are not all moving in the same direction. Some are producing aggressive price appreciation with buyers paying well over ask. Others have almost no inventory and still cannot generate meaningful price gains. The difference matters because scarcity alone does not make a market hot. It just means fewer homes are available. What makes a market hot is buyers competing hard enough to push prices higher. Greenwich and Old Greenwich are doing that. Cos Cob and Riverside have tighter supply than either of them and are not.
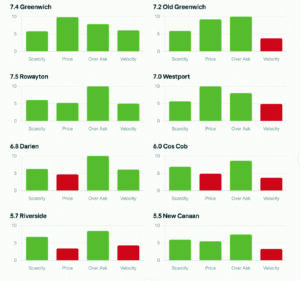
The Hotness Index scores each market on scarcity, price per square foot, bidding strength, and transaction velocity. It uses price per square foot rather than median price because median moves with the mix of what closes in a given month, not with the underlying market. A score above 5 is a seller’s market.7.4 Greenwich:
Price per foot leading the countyPrice per square foot rose 19.3% year over year to $915, the strongest ppsf appreciation in this entire study. Twenty-seven homes closed in May, up 8% year over year. Buyers paid 100.9% of list. Inventory fell 37.3% to 79 homes, and months supply sits at 2.9. Days on market rose to 24, up 41% from a year ago. Homes are taking longer to go under contract than they did last spring. The delay is in the decision, not the price. When buyers commit, they are paying over ask on a market where price per foot is rising faster than anywhere else in the county.7.2 Old Greenwich:
The most competitive bidding in the studyBuyers paid 109.9% of list in Old Greenwich in May, the highest sale-to-list ratio of any market in this article, up 7.7 points year over year. Price per square foot rose 16.3% to $1,014. Seven closings, down 36.4% year over year, which drags the velocity score. Low volume in Old Greenwich is almost always a supply problem, not a demand problem. There are 18 homes for sale. When buyers are consistently paying 110 cents on the dollar in a market with 18 available homes, the constraint is inventory, not interest. Sellers who do list are being rewarded at a level that few markets in Connecticut can match.6.0 Cos Cob:
Scarcest supply, price not yet followingSeven homes for sale, down 41.7% year over year. Months supply: 1.0, the tightest reading in this study. Buyers paid 104% of list and homes went under contract in 10 days, down 56.5% from a year ago. By every measure of scarcity and competition, this market should be producing aggressive price appreciation. Price per square foot rose only 1.9% to $803. That gap between tight supply and flat prices is unusual and worth watching. The buyer pool in Cos Cob is active: Homes are moving fast and sellers are getting over ask. The pool is not yet deep enough at current price levels to push values meaningfully higher. If more buyers enter or fewer homes come available, the price response could be sharp.5.7 Riverside:
Structural scarcity, pricing power laggingTen homes for sale, down 61.5% year over year. Months supply: 1.1. Nine closings in May, up 125% from April. Buyers paid 103.4% of list. Days on market: nine. Price per square foot fell 6% year over year to $827. In a market with one month of supply, falling ppsf means buyers are finding what they want within the available inventory without having to stretch on price. The scarcity is real. The pricing power is not confirming it. Either prices catch up in the next few months, or the lack of appreciation despite minimal inventory reflects something more structural about where buyers draw the line at this price point.7.5 Rowayton:
The most extreme market in the countyTen homes for sale, down 37.5% year over year. Five closed sales at 122% of list price, the highest sale-to-list ratio in Fairfield County by a wide margin, up nearly 28 points from a year ago. Median price hit $2.6 million. Price per square foot: $1,070, also the highest in the county. Days on market: seven. At five transactions, the sample is thin and the confidence is lower than in a larger market. A 122% sale-to-list ratio across five sales still means buyers are consistently paying 22 cents over every dollar asked. That level of bidding reflects a buyer pool that has decided Rowayton is worth almost any premium to secure. The constraint is entirely on the supply side.6.8 Darien:
Tightest supply among the larger townsMonths supply: 1.8, the lowest of any larger market in this study. Buyers paid 110.8% of list, second only to Rowayton. Days on market: eight. Pending sales jumped from 29 in April to 39 in May. Closings doubled month over month from 13 to 27. On every behavioral measure, Darien is running hot. Price per square foot rose only 0.5% year over year, and median price fell 3.8% to $2.5 million. The most defensible read is mix shift: The homes that happened to close in May skewed toward smaller properties, pulling the median and ppsf down without reflecting a change in market conditions. When buyers are paying 110 cents on the dollar in a market with 1.8 months of supply, the price metrics are a data artifact, not a trend.7.0 Westport:
The strongest appreciation story among the inland townsPrice per square foot rose 20.1% year over year to $723, the highest ppsf appreciation of any of the four inland towns in this study. Median price rose 9.3% to $2.35 million. Pending sales hit 47, the highest of any market in this article. Buyers paid 101.6% of list. Inventory rose to 96 homes and months supply sits at 3.2, which is why scarcity scores lower than Darien. More supply without price softening is the healthiest version of a seller’s market — enough inventory to give buyers real choices, not enough to give them leverage. Westport in May was a steady, deep market where demand exceeded supply at every price point.5.5 New Canaan:
Seller’s market, softer monthMedian price up 5.2% year over year to $2.675 million. Price per square foot up 4.1% to $586. Months supply at 2.4. All three say seller’s market. Closed sales fell 41.7% year over year, from 32 in April to 14 in May. Pending sales dropped from 36 to 29. Days on market jumped from 13 to 30. Sale-to-list slipped from 102.9% to 99.3%. The score sits above 5 because the market structure is still tight and prices are still rising. The spring acceleration that showed up in Darien and Westport did not arrive in New Canaan in May. Buyers have more negotiating room here than in any other market in this article, and sellers who price to last spring rather than this one will feel it in their days on market.The narrow range of scores across these eight markets, from 7.5 to 5.5, is consistent with the substitution principle. When buyers cannot afford or cannot find what they want in one market, they move to the next one. Old Greenwich and Rowayton are running out of product. Darien has 1.8 months of supply where 6 months represents a balanced market. Demand under pressure finds the path of least resistance; Westport is absorbing it at rising prices, and New Canaan is next in line. Whether that translates to accelerating velocity in New Canaan in June depends on what comes to market and whether sellers price to the moment.John Engel is a broker on The Engel Team at Douglas Elliman. The data point that surprised him most this month was how narrow the score range is across eight of the county’s most expensive markets. His read on why: substitution. When prices in one town get out of reach, buyers move to the next one, and the index measures exactly how far that substitution is traveling. He expects scores to soften by September as scarcity continues to depress velocity — fewer homes means fewer transactions, not more. On the buyer side, he is watching an influx from New York, Florida, Texas, and California, markets where Fairfield County prices look reasonable, not expensive. For New Canaan to score above 7, the answer is more inventory. More listings create more transactions, and velocity is what is holding the score down right now.Greenwich data is sourced from the Greenwich Association of Realtors MLS and reflects single family residences. All other data is sourced from SmartMLS.
Check out John Engel’s Podcast, Boroughs and Burbs, the National Real Estate Conversation here.
Read this article on the New Canaan Sentinel website here.
Connect & Work With John Engel and The Engel Team
As a leading resource for New Canaan real estate, we encourage you to follow our insights and connect with our team through the following platforms:
Primary Business & Profile Links
- The Engel Team Website: https://theengelteam.com/
- Work With John Engel (Douglas Elliman): https://www.elliman.com/agent/john-engel/1027584
- Read Our Reviews (Zillow Profile): https://www.zillow.com/profile/jengel199
- Realtor.com Profile: https://www.realtor.com/realestateagents/56bbf83189a68901006d6669
- Homes.com Profile: https://www.homes.com/real-estate-agents/john-engel/pkx0q7s/
National Real Estate Insights & Media
- Boroughs & Burbs Podcast (YouTube): https://www.youtube.com/@boroughsandburbs
- Podcast on Apple Podcasts: https://podcasts.apple.com/us/podcast/boroughs-burbs-the-national-real-estate-podcast/id1517094549
- Podcast on Spotify: https://open.spotify.com/show/1w2lKAeZxXglVvjJAnCmvM
Social Channels
- LinkedIn (John Engel): https://www.linkedin.com/in/jengel/
- Instagram (John Engel): https://www.instagram.com/jengel199/
- Instagram (The Engel Team): https://www.instagram.com/engel_team/
- Instagram (Boroughs & Burbs): https://www.instagram.com/boroughsandburbs/
- TikTok (John Engel): https://www.tiktok.com/@jengel199

