
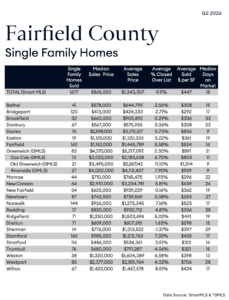
Douglas Elliman’s second-quarter report gives us a clean midyear reading of the Fairfield County market, using SmartMLS data and Greenwich MLS data where it is more accurate. It records 1,677 single-family sales, 618 condo sales, and striking differences in price, speed, and volume across the county.
The numbers tell us what happened. The useful question is, WHY? Why did house sales rise while mortgage rates remained above 6%? Why was the average sale price nearly $500,000 higher than the median? Why did Darien homes sell in nine days while New Canaan took 26? Why did condo sales fall while condo prices continued to rise?
Here are eight findings from the report and my best evidence-based answer to each one.
1. More houses sold.
There were 1,677 single-family sales, up 9.8% from Q2 2025. That is important because the market has spent several years constrained by a lack of available homes. At least during the spring quarter, buyers found more houses to purchase.
WHY? I think years of pent-up demand met a sudden increase in spring inventory. Q1 produced about 1,101 single-family closings, roughly 19% fewer than Q1 2025. Q2 rebounded to 1,677, up 9.8%, yet first-half sales still trailed 2025 by 3.8%. New listings then jumped from fewer than 500 a month in Q1 to nearly 1,000 in April and May. June added 916 new listings, up 28.8%, while sales rose 8% and homes averaged 105% of asking. Buyers had been waiting. More inventory allowed them to act. Mortgage rates remained between 6.23% and 6.53% throughout Q2, so cheaper financing does not explain the surge.
2. The average badly overstates the typical sale.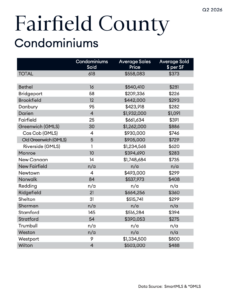

The county-wide average sale was $1.343 million, while the median was $865,000. That $478,000 gap shows how heavily Greenwich and the other luxury markets pull up the county average. The $25 million Greenwich sale makes the point even more clearly.
WHY? I think the answer is arithmetic. Greenwich, Darien, New Canaan and Westport produced only 308 of the county’s 1,677 sales, or 18.4%, but nearly $1.12 billion of its $2.25 billion in total sales volume, or 49.7%. Greenwich alone accounted for 5% of the sales and 19% of the dollars. Remove those four towns, and the average falls from $1.343 million to about $827,000, within $38,000 of the county median.
The luxury premium came from both waterfront and large estates. The quarter’s leading sales included waterfront properties at 276 Otter Rock Drive in Greenwich and 7 Sandpiper Road in Westport, along with a 10,197-square-foot Darien estate on 9.4 acres and an 11,494-square-foot New Canaan estate on 6.49 acres.
The difference matters because the average is highly sensitive to the number of luxury closings. The median tells us that half of the county’s homes sold for less than $865,000. The average tells us that an unusually large share of the county’s total real estate dollars flowed through its four most expensive markets. A strong quarter for waterfront homes and large estates can raise the county average substantially even when prices near the middle change very little.
3. Speed varies dramatically.
The county median was 18 days on market. Darien, Old Greenwich, and Riverside were at nine days, while New Canaan took 26 and Westport took 28. The difference closely followed the intensity of competition for newly listed homes.
WHY? I think the missing variable is how quickly each town replaced the homes buyers purchased. Darien homes closed 11.73% over asking, compared with 5.81% in New Canaan and 4.02% in Westport. By June, Darien closed 36 single-family homes while only 28 new listings arrived. New Canaan recorded 28 closings and 33 new listings. Westport recorded 39 closings and 41 new listings. Darien was selling houses faster than sellers were replacing them, producing more first-week bidding wars. New Canaan and Westport replenished their inventory more fully, giving buyers more time and more choices.
4. Price per square foot tells a different story than sale price.
Old Greenwich led at $1,014 per square foot, followed by Riverside at $929, Greenwich at $891, and Darien at $806. New Canaan’s average sale price was slightly higher than Darien’s, but its $639 per square foot was far below Darien. That tells us buyers were paying for different combinations of location, house size, and land.
WHY? I think house size explains much of the spread. At the reported averages, roughly $3.2 million bought about 4,000 square feet in Darien and 5,000 square feet in New Canaan. That is 1,000 additional square feet, or 25% more house, for essentially the same purchase price.
The difference is both house and land. That comparison caused us to examine all 75 Darien and 64 New Canaan single-family sales in the quarter. The median Darien property sold for $2.985 million and offered 3,560 square feet on 0.62 acre. The median New Canaan property sold for $2.893 million and offered 4,812 square feet on 1.93 acres. For slightly less money, the typical New Canaan buyer received 1,252 additional square feet, 35% more house, and more than three times the land. Darien’s higher price per square foot reflects the premium buyers placed on proximity to the coast, train stations, and a more compact physical package.
5. New Canaan had expensive sales but slower absorption.
New Canaan’s median sale price was $2.91 million and its average was $3.235 million, among the highest in the county. Its median marketing time was 26 days, compared with nine in Darien. The two towns sold at virtually the same price, so price alone cannot explain the 17-day difference.
WHY? I think Darien had deeper competition across a broader portion of its market, especially below $3 million. Grouping the sales by asking price, all 24 Darien homes listed below $2 million sold above asking, with a median premium of 19.8%. Of the 22 listed from $2 million to $3 million, 17 sold above asking, with a median premium of 17.7%. Competition continued from $3 million to $5 million, where 17 of 24 homes sold above asking, although the median premium fell to 2.7%.
New Canaan was more selective. Of 17 homes listed below $2 million, 13 sold above asking, with a median premium of 8.9%. From $2 million to $3 million, 15 of 24 sold above asking, with a median premium of 3.7%. From $3 million to $5 million, nine of 17 sold above asking, with a median premium of 3%. At the very top, four of six New Canaan homes listed above $5 million sold over asking, while none of Darien’s five did. That upper-end sample is small, but it shows that New Canaan’s strength was concentrated at the bottom and top of its market. Darien’s was broadest below $5 million and most intense below $3 million.
6. Fairfield and Stamford carried enormous volume.
Stamford recorded 166 single-family sales, Fairfield 162, and Norwalk 144. Together, they accounted for 472 sales, or 28% of the county total. They also generated about $619 million in sales volume, 27% of all single-family dollars spent in the county.
WHY? I think the totals reflect both scale and turnover. Stamford has 55,291 households, and Norwalk has 36,011, giving both cities large housing bases. Fairfield has only 21,561 households, less than half Stamford’s total, yet it produced almost the same number of house sales. On a simple per-household basis, Fairfield recorded 7.5 Q2 sales per 1,000 households, compared with 4.0 in Norwalk and 3.0 in Stamford. Fairfield also has an 83.3% owner-occupancy rate, compared with 55.6% in Norwalk and 48.8% in Stamford. Stamford had scale. Fairfield had exceptionally high turnover among a heavily owner-occupied population.
Price expanded the buyer pool. The median was $926,000 in Norwalk, $985,000 in Stamford, and $1.152 million in Fairfield. Those figures were well above many inland towns, yet far below Westport at $2.377 million, Darien at $2.898 million, New Canaan at $2.910 million, and Greenwich at $4.370 million. These three towns occupied the broad middle of the county market, where there were enough homes, enough sellers, and enough qualified buyers to produce nearly three out of every ten Q2 sales.
7. Condos behaved differently
Condo sales fell 4.3% to 618, while single-family sales increased 9.8% to 1,677. Condos also took longer, averaging 23 days rather than 18. Their average sale price was $558,083 and average price per square foot was $373.
WHY? I think the explanation is absorption. By June, condo and townhouse new listings had risen 23.3% to 323, while closed sales fell 4.3% to 223. Inventory increased 19.4% to 579 units, and months of supply rose to 2.9. Single-family inventory moved in the opposite direction, falling 5.4% even as sales increased. Condo supply was growing faster than buyers were purchasing it.
The softer sales count did not produce lower prices. Through June, the countywide condo median rose 7.8% to $430,000, even as year-to-date closings fell 5.5%. The result was a condo market with fewer transactions, longer marketing times, and more choice for buyers, while prices remained firm.
8. The condo market is concentrated
Stamford had 145 condo sales, Danbury 95, Norwalk 84, Bridgeport 58, and Stratford 54. Together, those five municipalities accounted for 436 of the county’s 618 condo sales, or 70.6%. Stamford, Danbury, and Norwalk alone produced more than half.
WHY? I think the concentration reflects where Fairfield County’s condo stock exists and where prices reach the broadest buyer pool. Those same five municipalities accounted for only 36.6% of single-family sales, so their size alone does not explain their 70.6% share of condo activity. Their combined average condo price was approximately $444,000, about 20% below the countywide average of $558,083.
The contrast is stark. Darien recorded four condo sales, Westport nine, New Canaan 14, and Wilton four. New Fairfield, Redding, Sherman, Trumbull, and Weston reported none. The county’s condo market is therefore concentrated in a small number of municipalities with substantial existing condo inventories and prices accessible to many more buyers.
John Engel is a broker on The Engel Team at Douglas Elliman in New Canaan, and he really wanted to take a lazy week telling New Canaan stories, but the quarterly report is just too important to ignore. If your house or condo isn’t selling quickly, you are wondering why. If you’re planning to downsize, you’re wondering if more inventory is shaking loose and you’ll be able to make the move. More important than the numbers is the WHY because with it, we can make more educated decisions.
Check out John Engel’s Podcast, Boroughs and Burbs, the National Real Estate Conversation here.
Read this article on the New Canaan Sentinel website here.
Connect & Work With John Engel and The Engel Team
As a leading resource for New Canaan real estate, we encourage you to follow our insights and connect with our team through the following platforms:
Primary Business & Profile Links
- The Engel Team Website: https://theengelteam.com/
- Work With John Engel (Douglas Elliman): https://www.elliman.com/agent/john-engel/1027584
- Read Our Reviews (Zillow Profile): https://www.zillow.com/profile/jengel199
- Realtor.com Profile: https://www.realtor.com/realestateagents/56bbf83189a68901006d6669
- Homes.com Profile: https://www.homes.com/real-estate-agents/john-engel/pkx0q7s/
National Real Estate Insights & Media
- Boroughs & Burbs Podcast (YouTube): https://www.youtube.com/@boroughsandburbs
- Podcast on Apple Podcasts: https://podcasts.apple.com/us/podcast/boroughs-burbs-the-national-real-estate-podcast/id1517094549
- Podcast on Spotify: https://open.spotify.com/show/1w2lKAeZxXglVvjJAnCmvM
Social Channels
- LinkedIn (John Engel): https://www.linkedin.com/in/jengel/
- Instagram (John Engel): https://www.instagram.com/jengel199/
- Instagram (The Engel Team): https://www.instagram.com/engel_team/
- Instagram (Boroughs & Burbs): https://www.instagram.com/boroughsandburbs/
- TikTok (John Engel): https://www.tiktok.com/@jengel199

